data visualization

elearninginfographics.com – The No.1 Source for the Best Blended Learning Infograpics
6 Essential Steps For Captivating Data Visualization

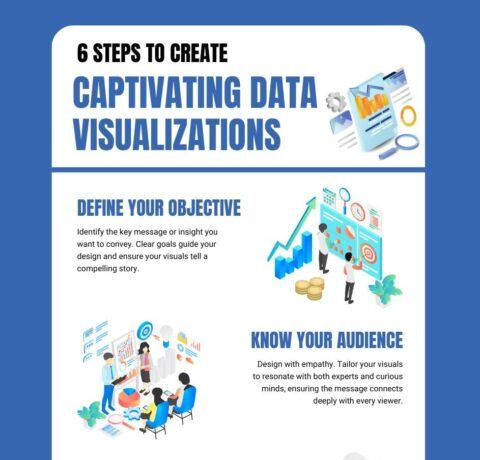
6 Essential Steps For Captivating Data Visualization—Infographic Discover the secrets behind transforming raw data into compelling visual stories with this infographic presenting 6 steps for captivating data visualization. Begin by clearly defining your objective to guide your narrative. Then, understand your audience to tailor your design for maximum clarity. Thirdly, select the most appropriate format, […]

The Power Of Data Visualization: Turning Complex Data Into Meaningful Insights

The Power Of Data Visualization: Turning Complex Data Into Meaningful Insights—Infographic Data visualization is the process of presenting complex data in visual formats such as charts, graphs, and dashboards to make information more accessible and understandable. By turning raw data into meaningful visuals, businesses can quickly identify trends, patterns, and insights that drive better decision-making. […]

Tips & Tools For Creating Infographics Infographic

Tips & Tools For Creating Infographics Infographic These days infographics can be found on all kinds of sites, from news portals to simple blogs. Whether you are selling something, or just blogging about everyday stuff, having an infographic on your blog every now and then will only bring you benefits. Yes, it might take some […]